Before we start to work with Appeon Performance Analyzer, let's learn how to start it and what it looks like first.
Appeon Performance Analyzer is turned on or off at application level. If you want to analyze an application by using Appeon Performance Analyzer, you need to deploy the application in a mode compliant with Performance Analyzer. To do this:
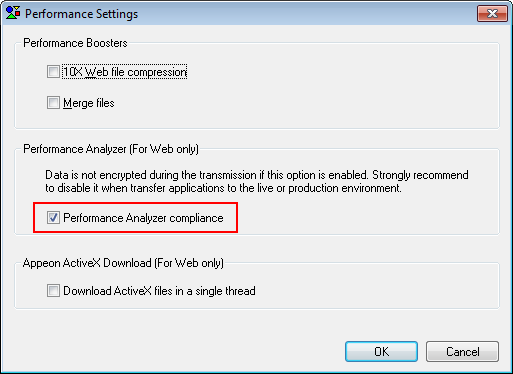
Step 1: Select the Performance Analyze compliance option in the Application Profile Configuration tool in Appeon Developer. It is not selected by default.
Step 2: Deploy the application using the Appeon Deployment Wizard in Appeon Developer.
The application files are deployed and generated in a mode compliant with the Performance Analyzer tool.
Note: as the data is not encrypted during transmission at runtime, therefore, the Performance Analyze compliance option is recommended to use only at the test or development stage. When the application is ready to go live in a production environment, turn off this option and then re-deploy the application, to ensure data is encrypted during transmission.
Performance Analyzer is a Web tool that can only be launched side by side with the Web application you want to analyze.
Notes:
-
Appeon Performance Analyzer can only run on a 32-bit operating system.
-
Appeon Performance Analyzer can only run in Internet Explorer, and cannot run in the other Web browser such as FireFox, Chrome, Opera, etc.
-
For the first time to run it, users should log into Windows as an administrator and turn off UAC (if using Windows Vista, Windows 7 etc.). To turn off UAC, go to Windows Control Panel > User Accounts, click Turn User Account Control on or off, then uncheck the check box of Use User Account Control (UAC) to help protect your computer.
You can start Appeon Performance Analyzer by the following steps:
Step 1: In Internet Explorer, run the Web application you want to analyze. The URL of the Web application should look like this: http://hostname:port/applicationname/x32_index.htm.
Note: Hostname indicates the IP address or machine name of the Web Server, and port indicates the HTTP port number of the Web Server. Port is optional and specifies the port number that your Web Server accepts for HTTP connections. If it is not specified, the default port is 80. If several Web Servers are running on the same machine, make sure that the port specified is a port of the Appeon Web Server.
Step 2: When the application has started up, append "?performance=1" to the application URL in the IE address bar and press Enter to refresh the application.
So the complete URL should look like http://hostname:port/applicationname/x32_index.htm?performance=1 or http://hostname:port/applicationname/x32_application.htm?performance=1.
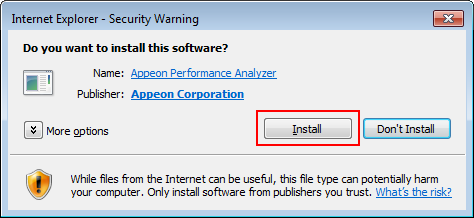
If the Performance Analyzer is run for the first time, you will be prompted to install the Appeon Performance Analyzer add-on. Click Install.

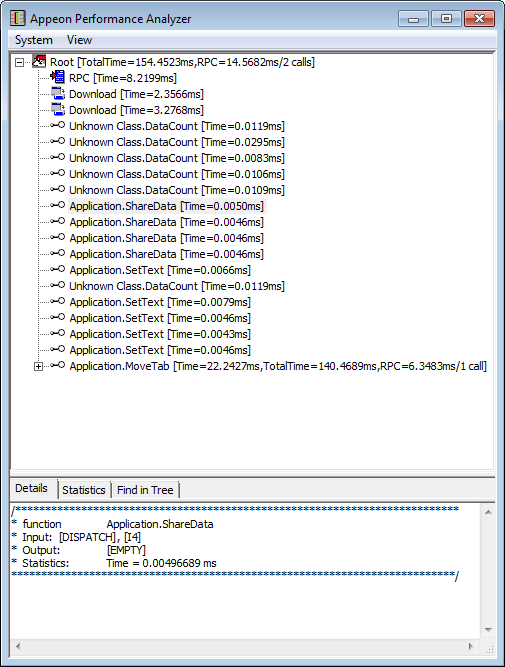
Appeon Performance Analyzer will start up side by side with the Web application. The main window of Appeon Performance Analyzer looks like this.
Appeon Performance Analyzer will automatically open when the Web application runs by URL http://hostname:port/applicationname/x32_index.htm?performance=1, unless you deselect the Show window when started option in the Appeon Performance Analyzer Configuration dialog (from menu System > Config). See System Configuration for details.
Appeon Performance Analyzer window includes three parts:
1 - The menu bar
The menu bar includes all the settings for Performance Analyzer. You can get detailed information from the sections below.

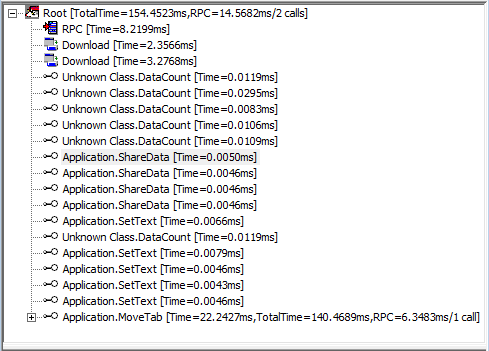
2 - Analyzing panel
The Analyzing panel displays the data analyzed by the Performance Analyzer in a treeview. Each node of the tree represents a JS call, AX call, RPC call or Download.
3 - Detail view panel
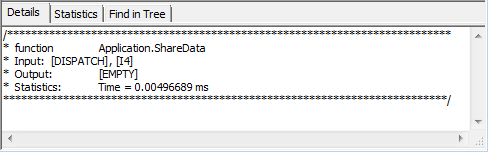
The Detail view panel shows the detailed information of the selected tree node, and also shows the statistics and search results.
In order to remove Appeon Performance Analyzer completely, you can follow the steps below:
Step 1: Make sure that the user has administrator permission, and then turn off UAC and IE.
Step 2: Open the command window and enter the following commands one by one:
regsvr32 -u "%systemroot%\downloaded program files\APBPanalysis.dll"
del "%systemroot%\downloaded program files\APBPanalysis.dll"
del "%systemroot%\downloaded program files\APBPanalysis.inf"
del "c:\performance\EonTracer.ini"
del "c:\performance\EonTracer.log"
rd "c:\performance"
After all the commands above are run, the Appeon Performance Analyzer is removed completely.
